Examples
Below are a few snapshots of Mimi's interactive UI, referred to as the Explorer and enabled with the explore and plot functions. This is mean to be a teaser windown into Mimi's functionality, and we direct interested parties to the github Documentation for further information.
Models
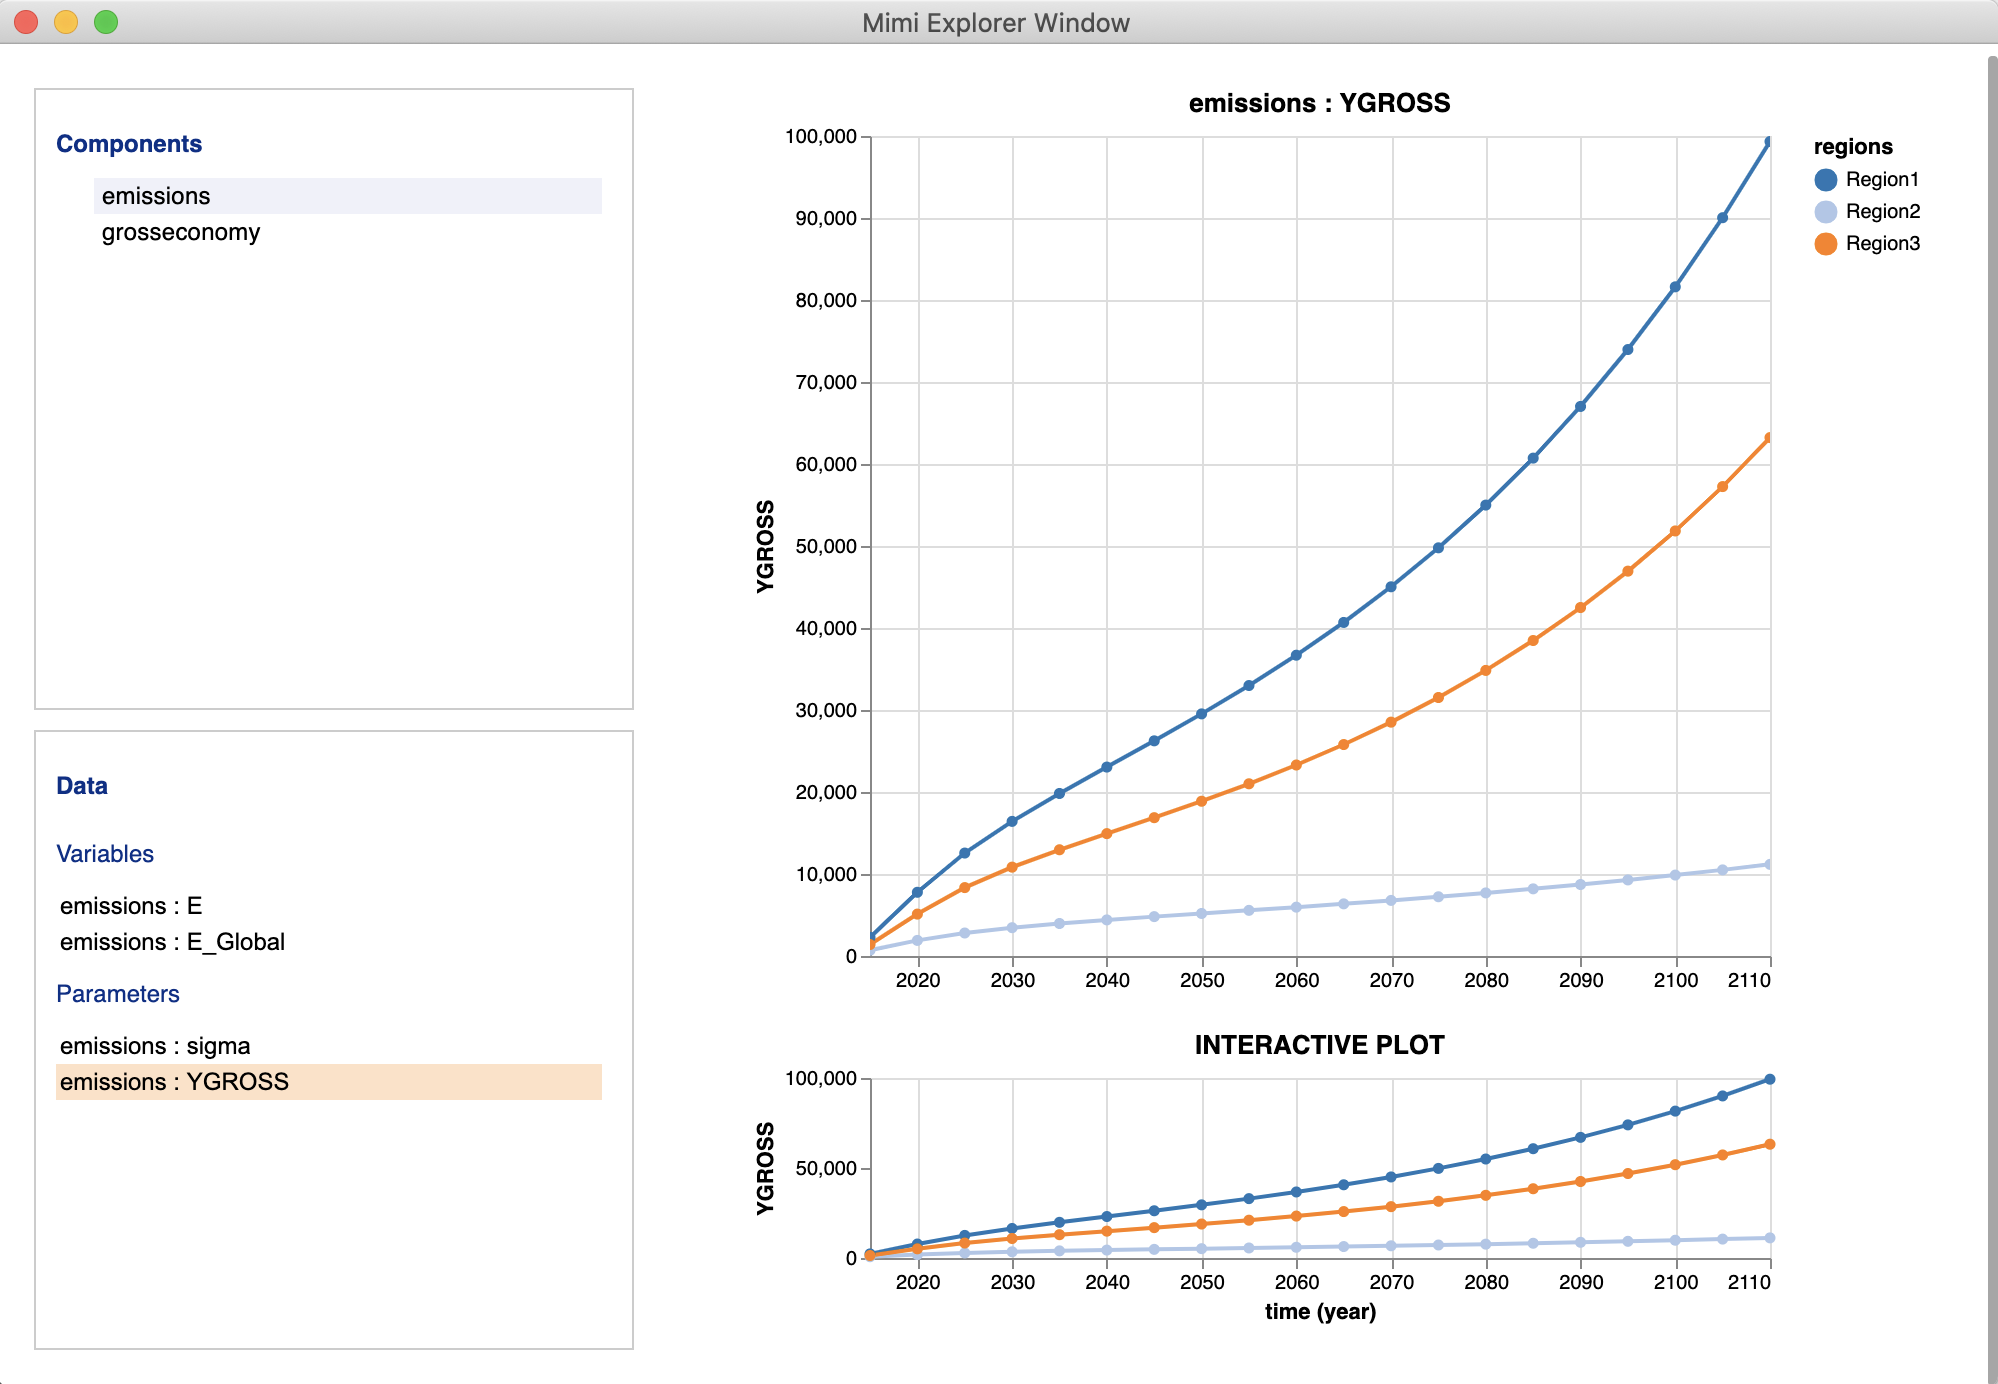
After creating and running a model using the Mimi framework, users are able to interactively explore the parameters and variables associated with their model using the explore function:
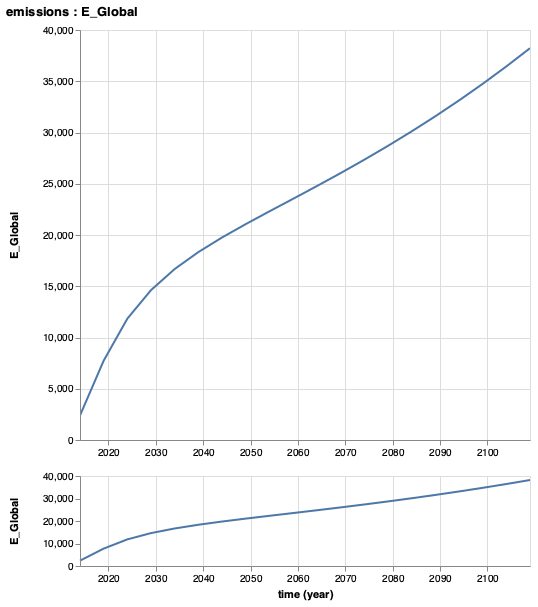
And plot individual parameter or variable results using the plot function:
Monte Carlo Simulations
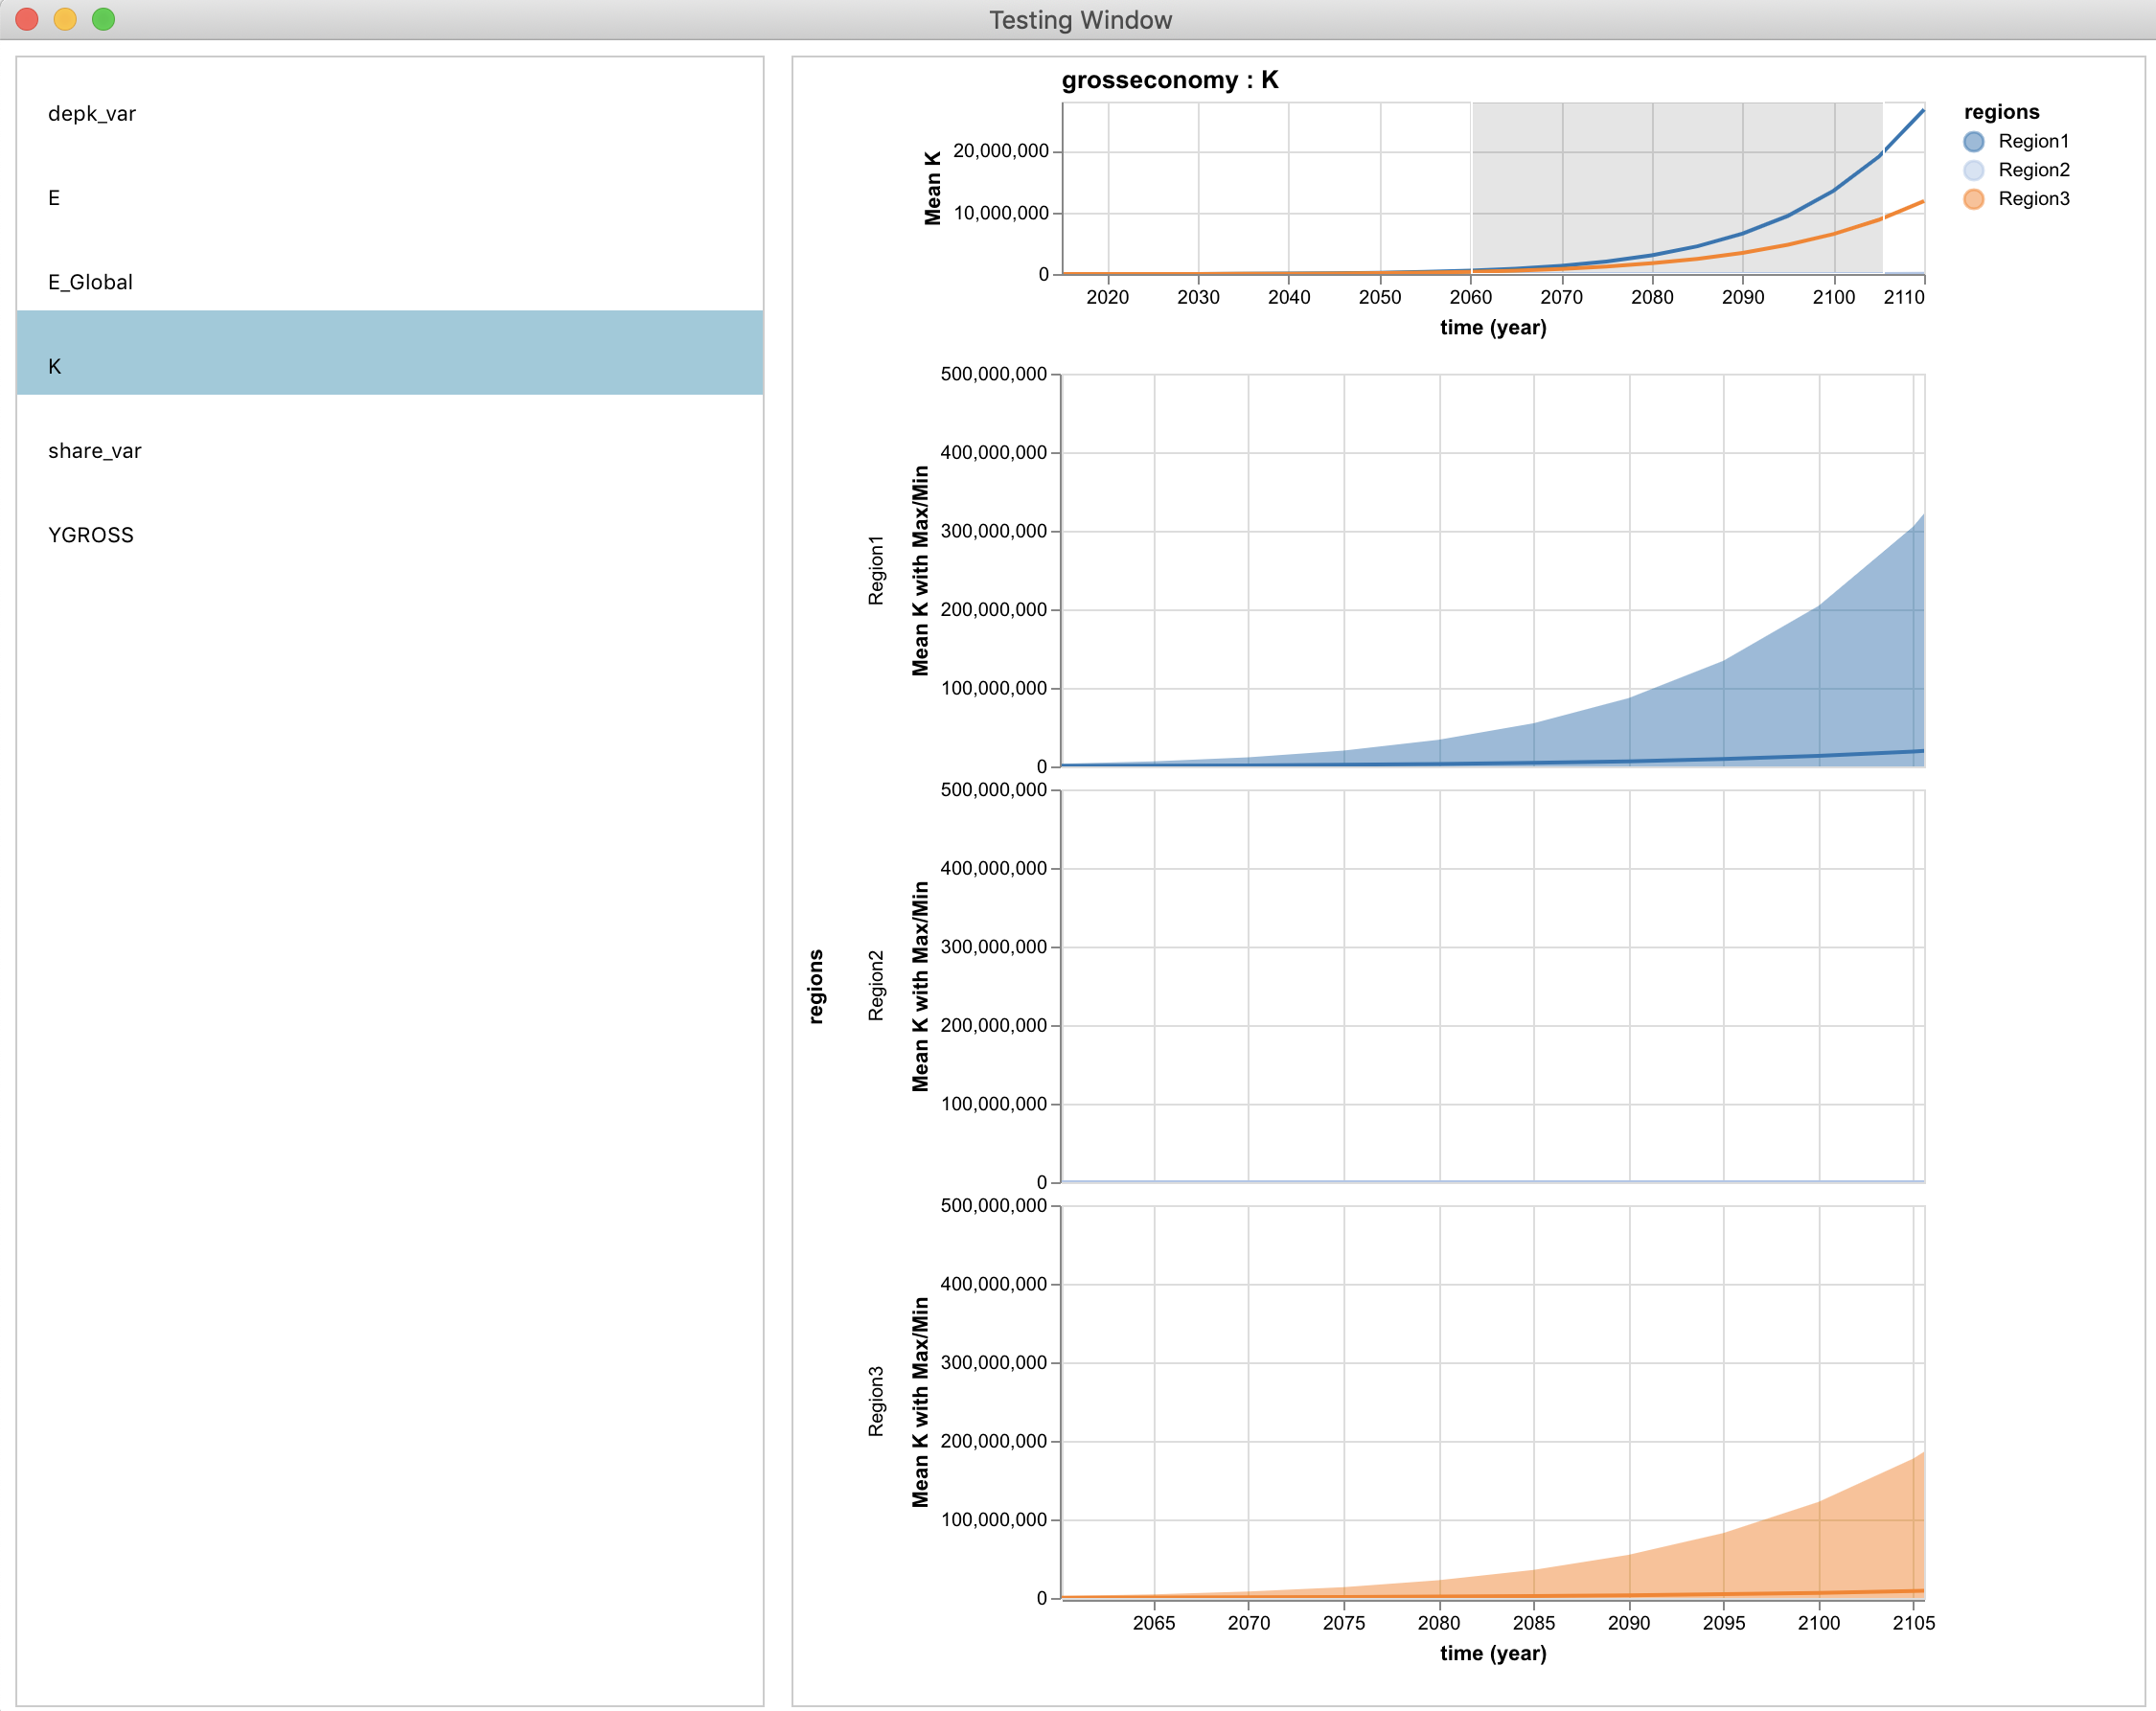
Mimi also provides support for running Monte Carlo simulations, and using the same API as above users can interactively explore the distributions of the resulting variables using the explore function:
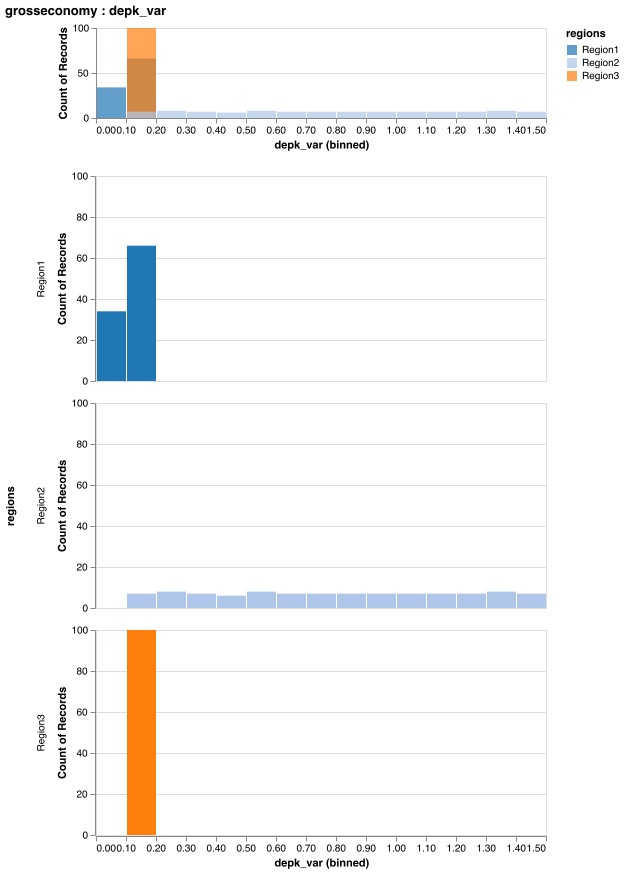
And plot individual distribution results using the plot function:
Sensitivity Analysis
Mimi includes a host of routines which support running various sensitivity analysis methods on Mimi models.
David Anthoff, Richard Plevin, Cora Kingdon, and Lisa Rennels
Last modified: August 19, 2022
Website built with Franklin.jl.