How-to Guide 2: View and Explore Model Results
This guide show show to access the numerical values of your results in a usable format, and also how to plot your results.
Accessing Results
After a model has been run, you can access the results (the calculated variable values in each component) in a few different ways. Note that if you have used composite components and wish to access results deeper than the the parameters and variables available in your top-level components you may need the special syntax in the Composite Component Details subsection below.
You can use the getindex syntax as follows:
m[:ComponentName, :VariableName] # returns the whole array of values
m[:ComponentName, :VariableName][100] # returns just the 100th value
Indexing into a model with the name of the component and variable will return an array with values from each timestep. You can index into this array to get one value (as in the second line, which returns just the 100th value). Note that if the requested variable is two-dimensional, then a 2-D array will be returned.
You can also get data in the form of a dataframe, which will display the corresponding index labels rather than just a raw array. The syntax for this is:
getdataframe(m, :ComponentName=>:Variable) # request one variable from one component
getdataframe(m, :ComponentName=>(:Variable1, :Variable2)) # request multiple variables from the same component
getdataframe(m, :Component1=>:Var1, :Component2=>:Var2) # request variables from different components
Composite Component Details
[TODO]
Plotting and the Explorer UI
Mimi provides support for plotting using VegaLite and VegaLite.jl.
Plotting support is provided by the Explorer UI, rooted in VegaLite. The explore function allows the user to view and explore the variables and parameters of a model run. The explorer can be used in two primary ways.
In order to invoke the explorer UI and explore all of the variables and parameters in a model, simply call the function explore with the model run as the required argument as shown below. This will produce a new browser window containing a selectable list of parameters and variables, organized by component, each of which produces a graphic. The exception here being that if the parameter or variable is a single scalar value, the value will appear alongside the name in the left-hand list.
run(m)
explore(m)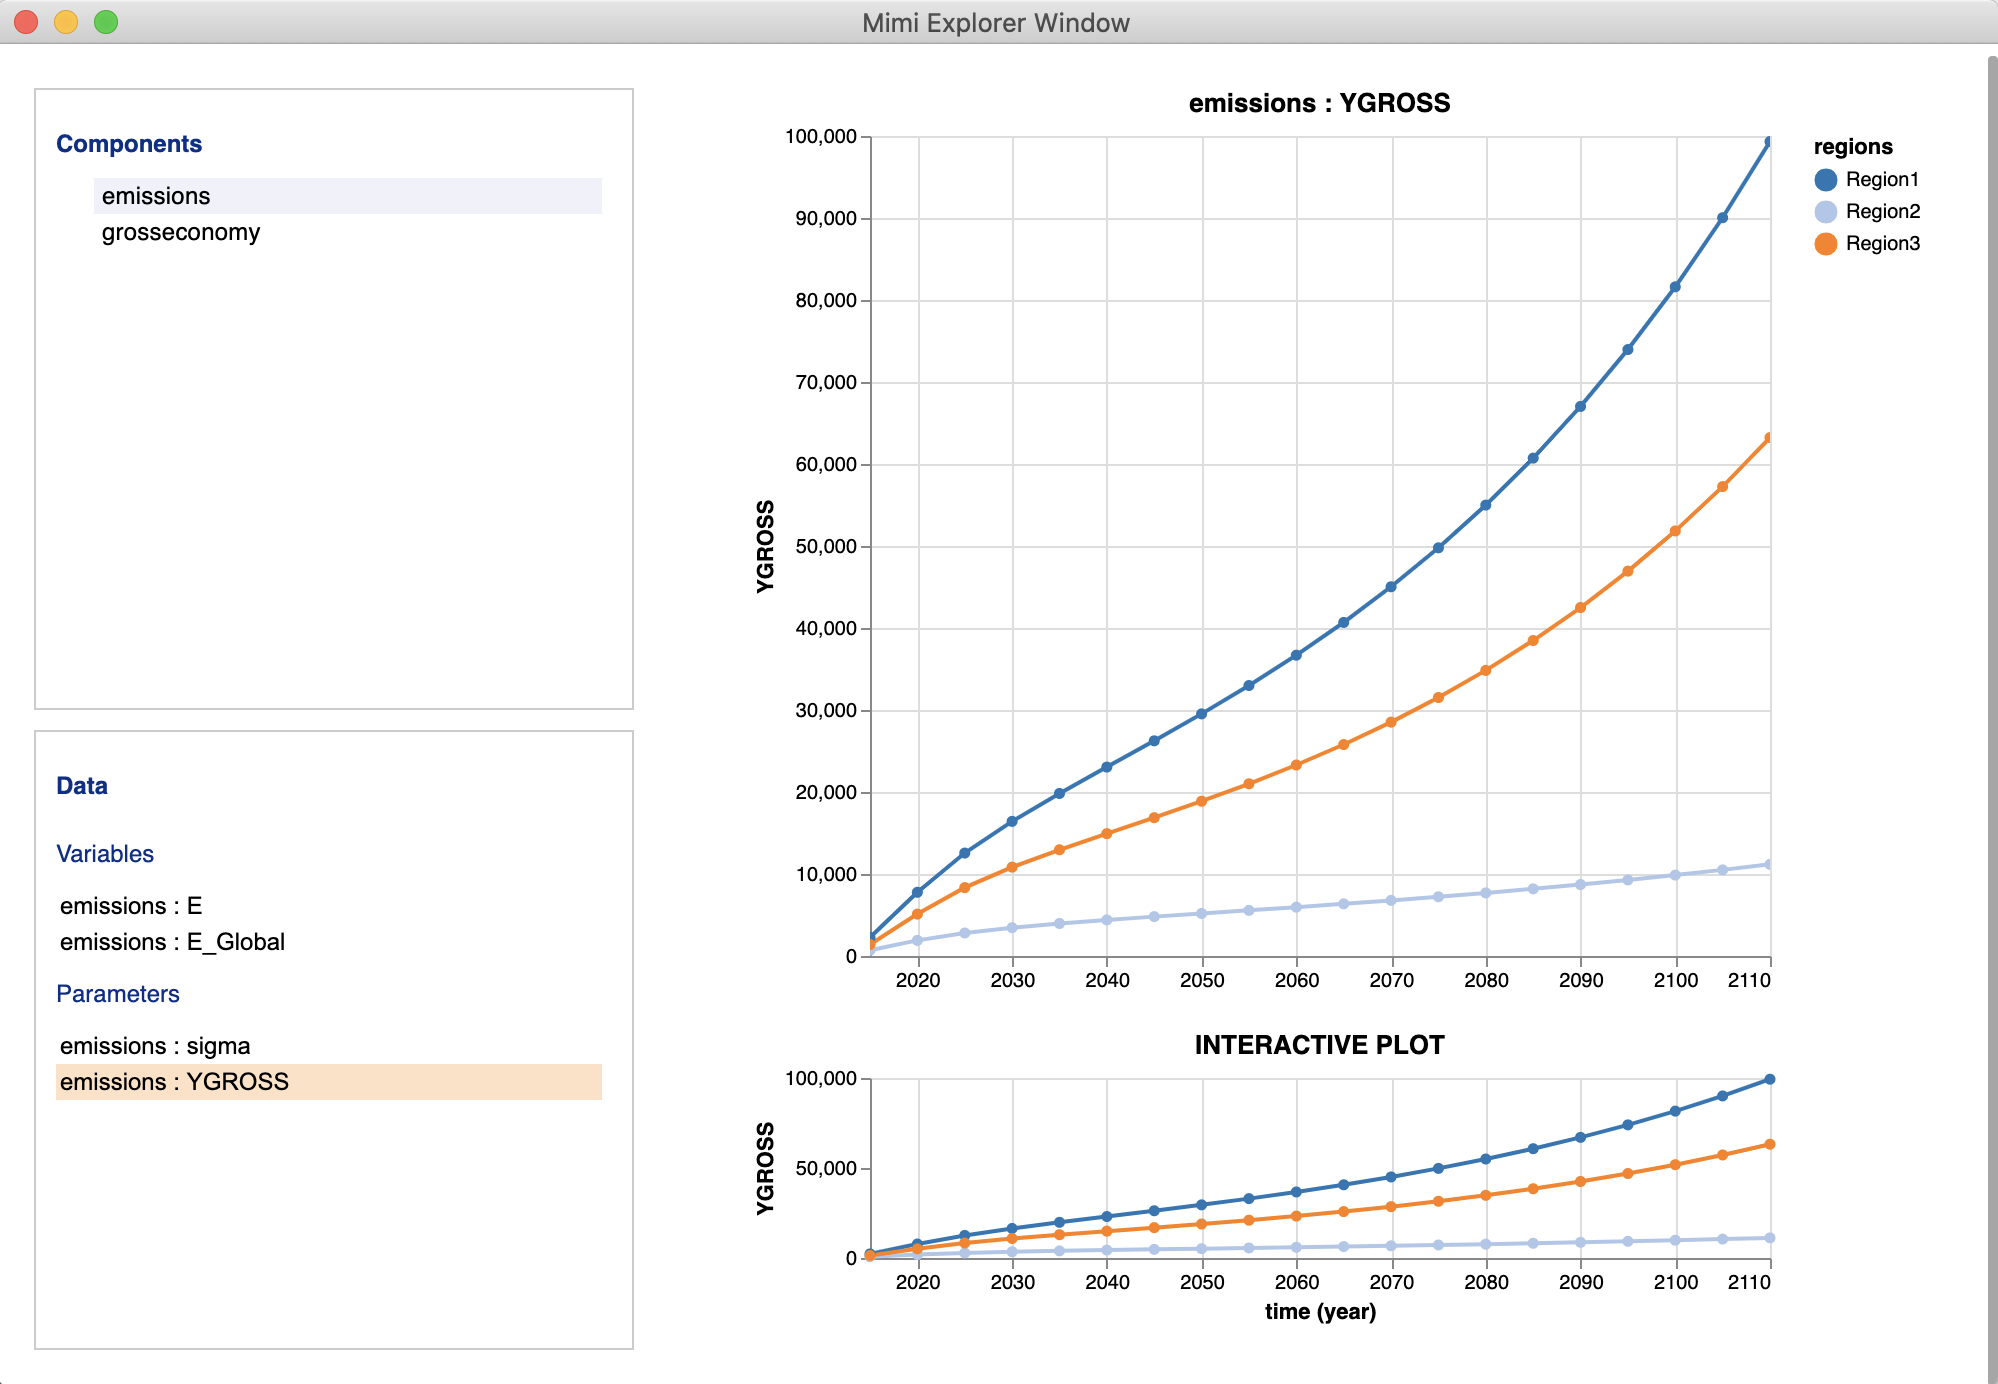
Alternatively, in order to view just one parameter or variable, call the (unexported) function plot as below to return a plot object and automatically display the plot in a viewer, assuming plot is the last command executed. Note that plot is not exported in order to avoid namespace conflicts, so needs to be called with Mimi.plot or a user may import it if desired. This call will return the type VegaLite.VLSpec, which you may interact with using the API described in the VegaLite.jl documentation. For example, VegaLite.jl plots can be saved as PNG, SVG, PDF and EPS files. You may save a plot using the save function.
Note that saving an interactive plot in a non-interactive file format, such as .pdf or .svg will result in a warning WARN Can not resolve event source: window, but the plot will be saved as a static image. If you wish to preserve interactive capabilities, you may save it using the .vegalite file extension. If you then open this file in Jupyter lab, the interactive aspects will be preserved.
using VegaLite
run(m)
p = Mimi.plot(m, :ComponentName, :ParameterName)
save("figure.svg", p)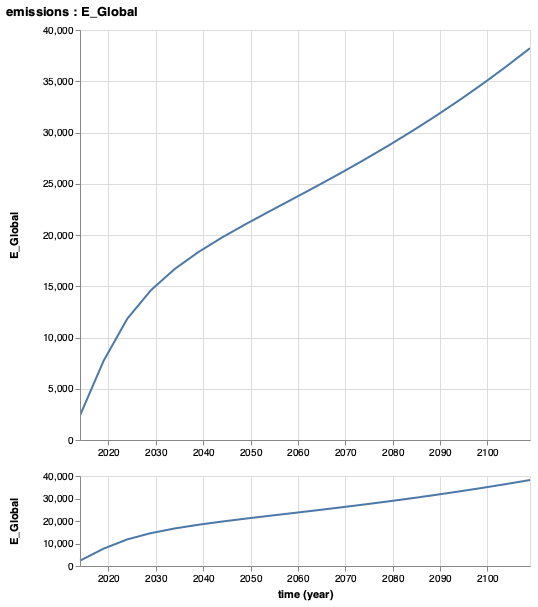
These two functions, explore and plot also have methods applicable to the sensitivity analysis support described in the next section. Details can be found in the sensitivity analysis how-to guide How-to Guide 3: Conduct Sensitivity Analysis as well as Tutorial 4: Sensitivity Analysis (SA) Support.